This is part 4 in a series of blog posts that describe how to use Gephi for social network analysis (SNA) when using cuneiform sources. In this tutorial you will learn how to transform a 2-mode network into a 1-mode network by using a plugin in Gephi.
Part 1: Acquiring a Dataset via Prosobab
Part 2: Cleaning your Dataset
Part 3: Data Preparation for Gephi
Part 4: Data Import for a 2-mode Network
Part 5: Transforming a 2-mode Network into a 1-mode Network
See also the theoretical guide that describes how Assyriologists can apply SNA to cuneiform sources — Social Network Analysis and Cuneiform Archives.
Introduction
There are several possibilities to transform a 2-mode network into 1-mode. In principle, you need a matrix which lists each person’s co-occurrence with another person. Experienced computer scientists directly apply matrix multiplication to implement the transformation, less experienced ones tend to create their own matrix within the Excel sheets they use for the data import — this can be extremely time consuming once you have more than 50 texts. It is also extremely error prone and therefore highly discouraged. In this practical guide, I will walk you through another option: using a Gephi plugin called “MultimodeNetworksTransformation”. Having a plugin to do all the hard work for you might sound like an easy option, but using this plugin is not as intuitive as one would wish. However, the trick itself is simple and quick!
The version used in this blog post is Gephi 0.9.2, and the operating system is MacOS Mojave 10.14.6. Depending on the version of Gephi and the operating system you use, the screens and menus can look slightly different on your computer. However, the workflow presented here should apply nevertheless.
Install the “MultimodeNetworksTransformation” plugin
Before starting with the data import, you need to install a plugin. First, open Gephi. Then click on the tab Tools > Plugins. A new window opens. From there, select the box “Available Plugins” and find the “MultimodeNetworksTransformation” plugin. Download it and then restart Gephi before using this plugin.
Remember to refer to the plugins you used when you present your research!
Import data
Now that you have installed the plugin and have restarted Gephi, we can move on to data import. Basically, you will import the data the same way you did for the 2-mode network. There is only one difference. You have to create an additional column for the Nodes sheet and name this column “Category”. Fill this column with the value “Person”. Then, import the data the way it is described for creating a 2-mode network (see Part 4).
You can use the dataset I have prepared (BR & MR dataset 1-mode) for a quick tryout. It is the same dataset that I shared for a 2-mode network in Part 1, but with the changes necessary for a 1-mode network.
Data transformation
When your data is imported, save it with a file name of your choice, e.g. “Network import 2-mode”. Then, select File > Save As… > and save it with another file name, e.g. “Network 1-mode”. If something goes wrong, you do not have to import the data all over again.
| Tips for MultimodeNetworksTransformation: |
| 1. Find your “MultimodeNetworksTransformation” plugin.
a) It should be already on your Gephi screen as a tab. b) If not, you can open it in the following way: click on the tab Window > Multimode Projections. Now you should see it on your Gephi screen. |
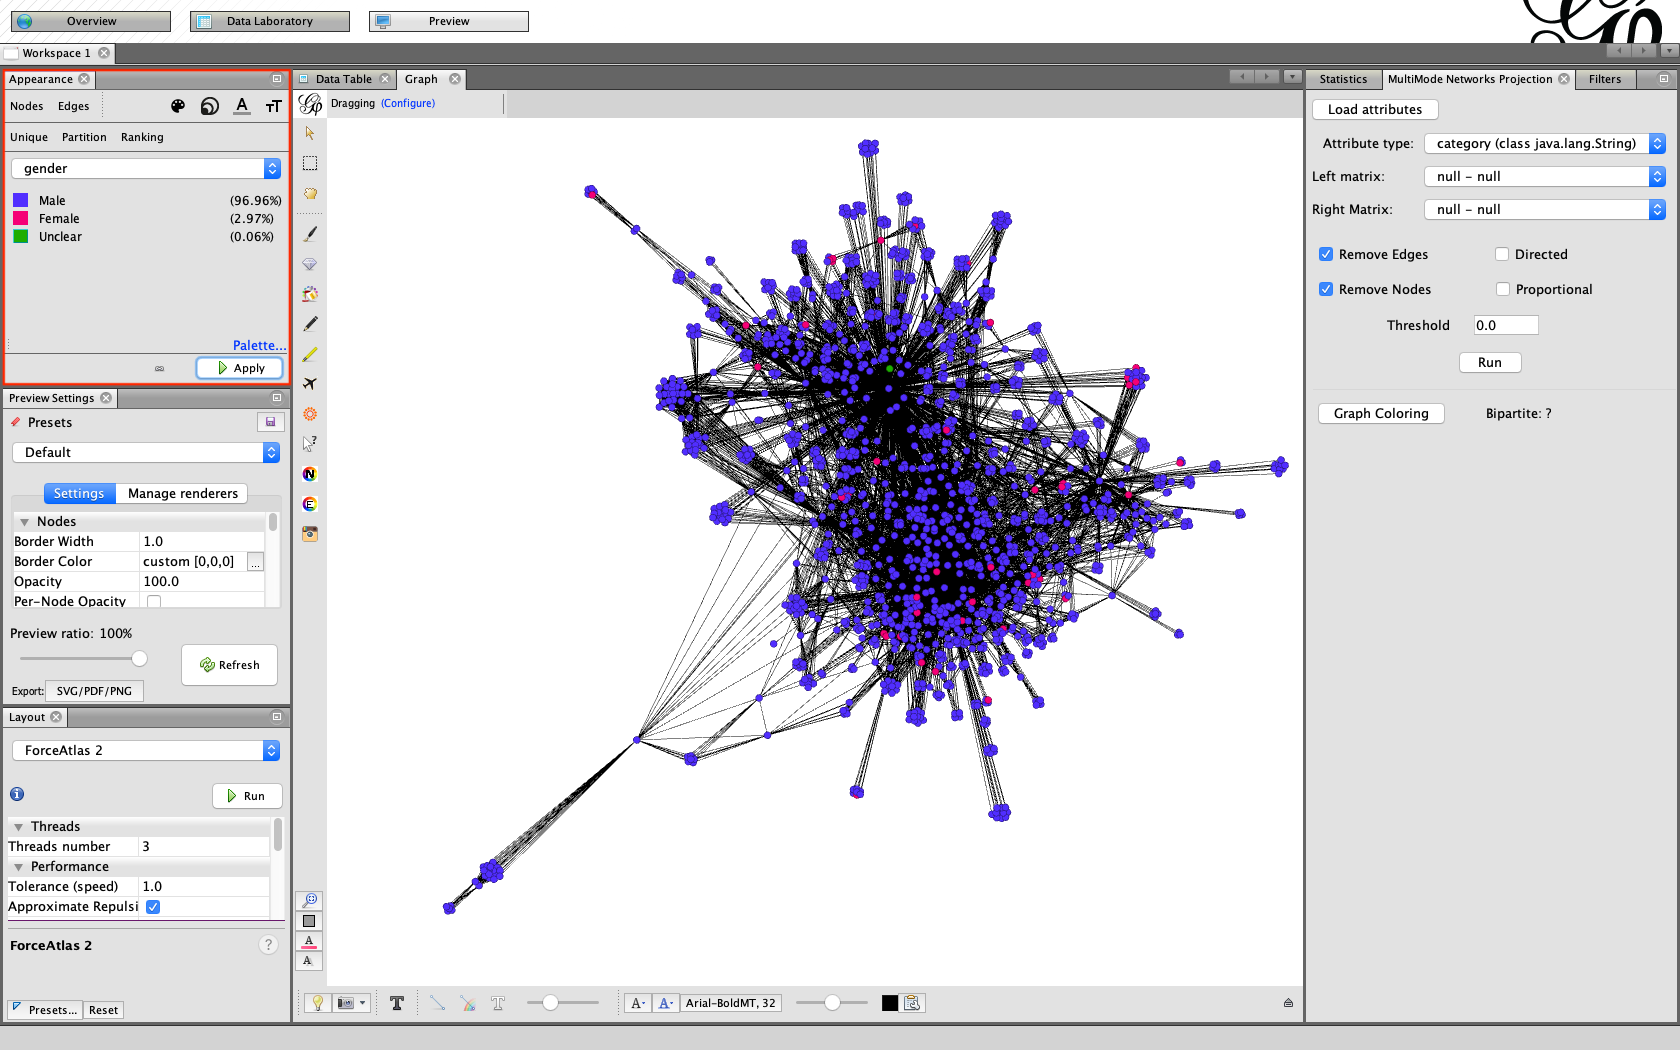
| 2. In the plugin window, select “Load Attributes”, and choose attribute type. In this case, it is the column “Category”. |
| 3. Select “Person-null” in the left matrix, and “null-Person” in the right matrix. |
| 4. Click on the buttons “Remove Edges” and “Remove Nodes”. |
| 5. Then, hit the button “Run”.
Now the plugin will remove the texts as nodes but will keep them as edges, i.e. as a direct link between individuals. As a result, you will have a person-to-person network! |
NB! You might need to save the results, close and reopen the program before you can continue with layout and statistics.
NB! If the path described above did not give you the results you wished for, you could try out some of the other options that are possible with the same plugin. See the links below for more options.
How do I know it worked?
You can test whether the transformation is correct in two ways.
First, by looking at the data laboratory tables for Nodes and Edges. The attempt has been successful if both tables still contain data. The Nodes table should now only include the data from the person category, with texts removed. The Edges might lose some of the columns (i.e. “attribute data”), and this table gets an additional column “MMNT-EdgeType”, with the value “Person <—> Person”.
Second, both the graph and the preview tables should now show only individuals as nodes – these individuals are connected to other individuals directly, and the texts as nodes are gone.
Gephi offers various plugins in addition to its main settings. Many of these plugins are created by the users and are free to use. You can view the options here or from the program itself under the tab Tools > Plugins.
Bibliography:
- http://www.martingrandjean.ch/gephi-introduction/
- https://shawngraham.gitbooks.io/dh-workbook/content/docs/supporting%20materials/multimode-networks.txt.html
For further reading on Gephi and SNA:
- Cherven. K. 2013: Network Graph Analysis and Visualization with Gephi, Birmingham and Mumbai.
- Cherven, K. 2015: Mastering Gephi Network Visualization, Birmingham.
If you encounter any problems or find information that needs to be updated, you can let me know via email: m.seire[at]hum.leidenuniv.nl.
Author: Maarja Seire
Published on 28 January 2020
