This is Part 3 in a series of blog posts that describe how to use Gephi for social network analysis (SNA) when using cuneiform sources. By the end of this part of the guidelines, your data will be ready for import into Gephi.
Part 1: Acquiring a Dataset via Prosobab
Part 2: Cleaning your Dataset
Part 3: Data Preparation for Gephi
Part 4: Data Import for a 2-mode Network
Part 5: Transforming a 2-mode Network into a 1-mode Network
See also the theoretical guide that describes how Assyriologists can apply SNA to cuneiform sources — Social Network Analysis and Cuneiform Archives.
Preparing the dataset for Gephi
The easiest way to get your data into Gephi is by importing it from a Microsoft Excel file. Gephi requires data to be imported by using two separate sheets, one sheet for “nodes” and another sheet for “edges”. You should therefore separate your data so that it is on two different sheets, either in one file or as two files. Personally, I would recommend you to create two new, additional sheets in the same Excel file: one titled “nodes” and another titled “edges”. Then, you can copy-paste all data onto these two sheets from the “original sheet”.
| Tips for handling your data: |
| 1. Filter your data!
Do it for all of your sheets, as this is not done automatically when you copy-paste filtered data! By using the filter, you will not mess up your data when you reorder certain columns. There are two ways to do this: a) Select all tables and rows (Ctrl+A) and select tab Home > Filter. b) From the menu bar of the program, select tab Data > Autofilter. |
| 2. Save different versions of your data!
While you are working with your data, make duplicates of the files. In case your data gets messed up, you can always go back to the previous versions! |
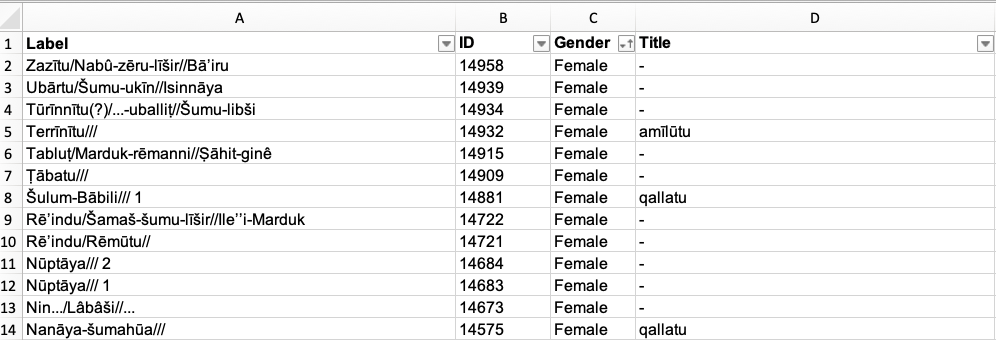
a) Nodes sheet
When you import the Excel sheet with nodes into Gephi, the program requires the columns “ID” and “Label”.
- ID is used to connect the Excel sheet with nodes to the Excel sheet with edges (Prosobab: PID = ID).
- Label is what you want to call the corresponding ID value on the nodes sheet (Prosobab: Name = Label).
In a two-mode network, the nodes sheet includes a list of individual persons and of individual texts in which these people appear. The connection between the two nodes is made on the Edges sheet.
Gephi only wants unique values in both ID and Label columns on the Nodes sheet (in the Edges sheet you will have repeating values). That means you have to have a code (i.e. either a unique name or number) for the person only once in the column ID, and the same applies for your Label column. For example, ID “123” is “Ardia 1” while ID “234” is “Ardia 2”. You cannot have number “123” twice in the same column ID nor the name “Ardia” twice in the column Label. That could mess up your data in Gephi.
You might have created duplicates for your data by accident, or they might be inherent to your data entry procedure — this also applies to Prosobab data. See the tips in the box below in order to clean up repeating values in your data.
| Tips for cleaning your data in Excel: |
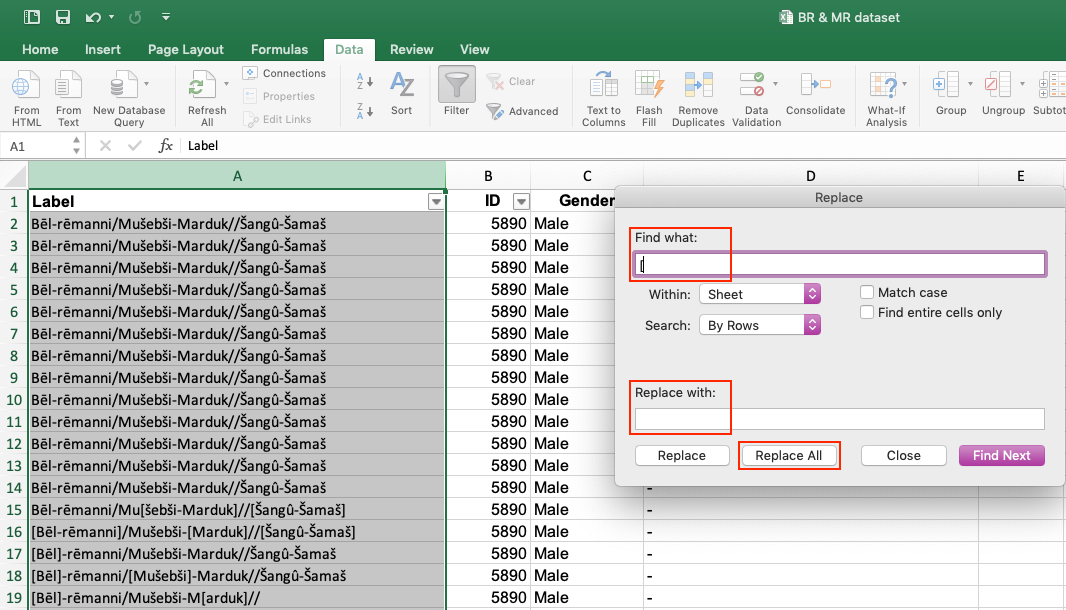
| 1. Delete square brackets.
This step is necessary in order to continue with cleaning up your data according to the needs of Gephi because it shows you which individuals occur several times. Gephi will not be able to ignore the square brackets, so it would read Ard[ia] and Ardia as two different individuals. Same applies for Excel when you are removing the duplicates (see below). If you trust the reconstructions made by Prosobab, remove the square brackets to indicate reconstructed names — if you do not, feel free to make your own identifications. For your own use, you should have the original data exported from Prosobab saved in another file. In case of doubt, you can always go back to it and check whether your data needs corrections. To delete square brackets, follow these steps: 1) Select the column Label. 2) Click on the tab Edit > Find > Replace. A new window will open. There you can find all “[“ and replace them with nothing. Do the same for all “]”. (NB! Do not type the quotation marks, type only the square bracket.)
|
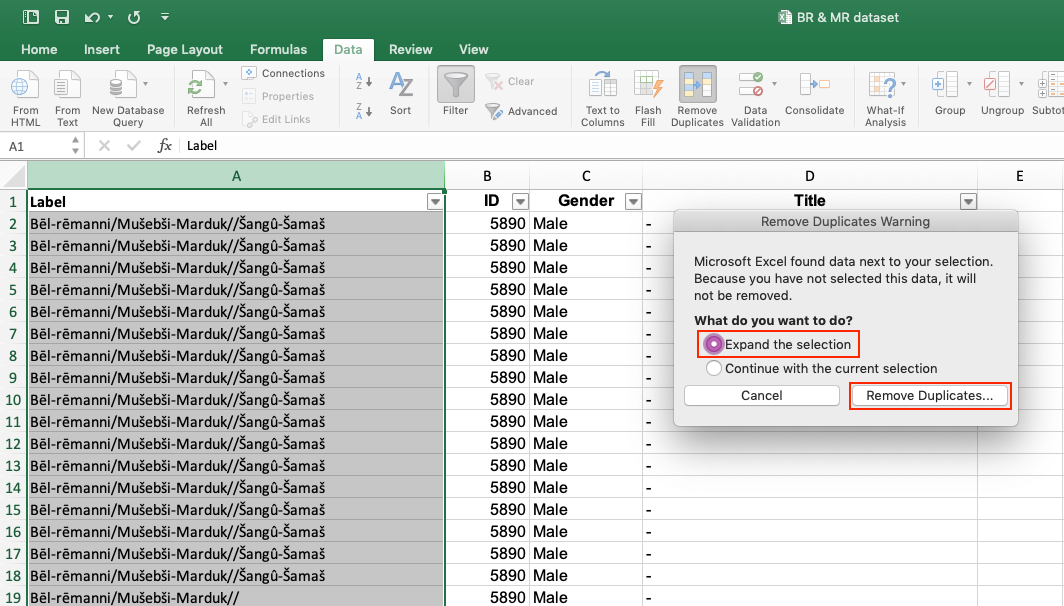
| 2. Removing fully duplicated rows.
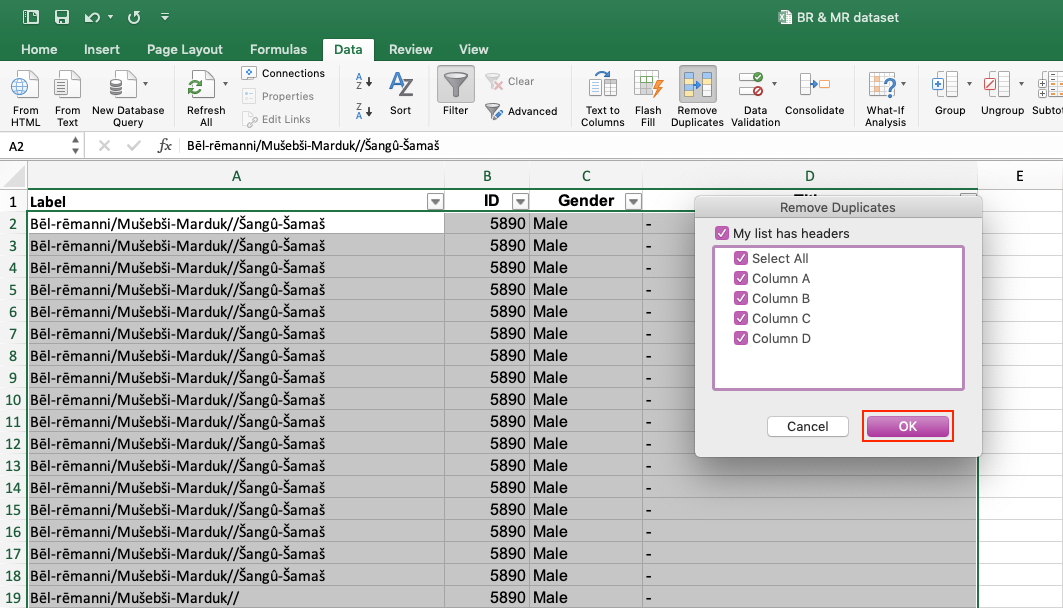
This step removes duplicate rows in which all columns contain the same information, leaving you only with unique values. In order to automatically delete duplicates, follow these steps: 1) Select all your data (Ctrl +A). 2) Click on tab Data > Data Tools > Remove Duplicates.
3) Another box opens. Make sure that all the columns are selected to remove duplicate data.
|
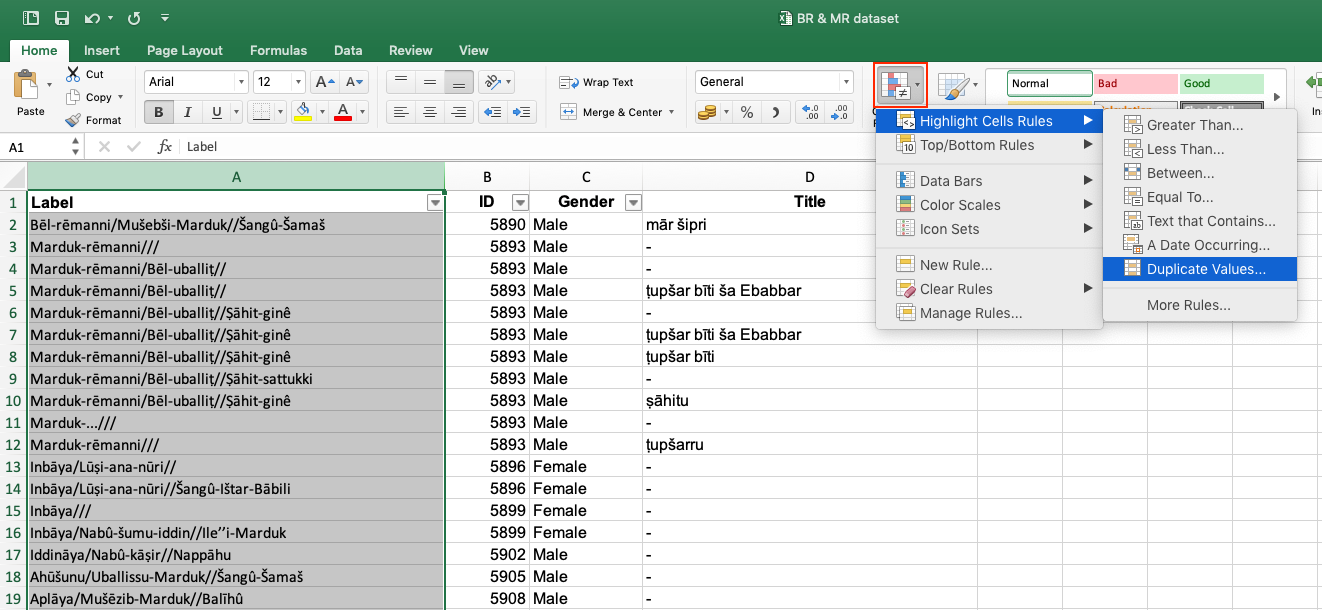
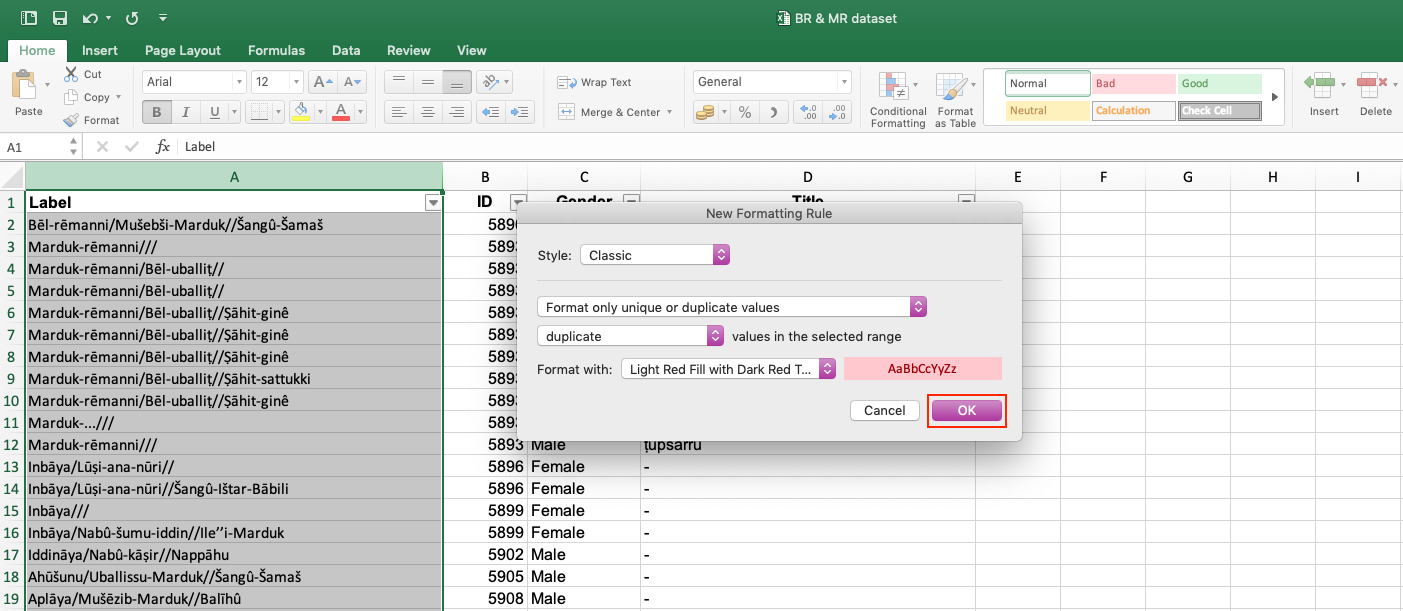
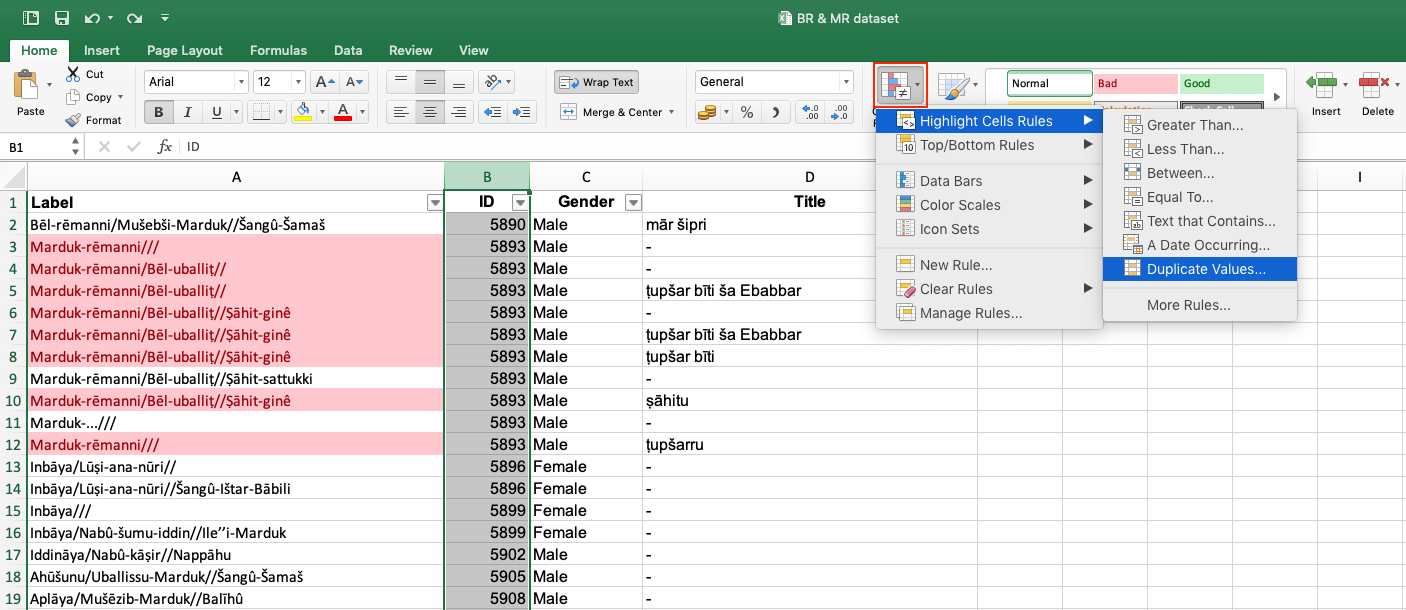
| 3. Highlighting duplicates in the Label column.
This function is particularly helpful in checking your data for repeated values and transforming them into unique values. It is especially important to include this step because there are quasi-duplicates in your data, e.g. identical names but different individuals. To highlight duplicates, follow these steps: 1) Select the column you want to highlight the duplicates in. 2) Select tab Home > Conditional formatting > Highlight Cells Rules > Duplicate Values.
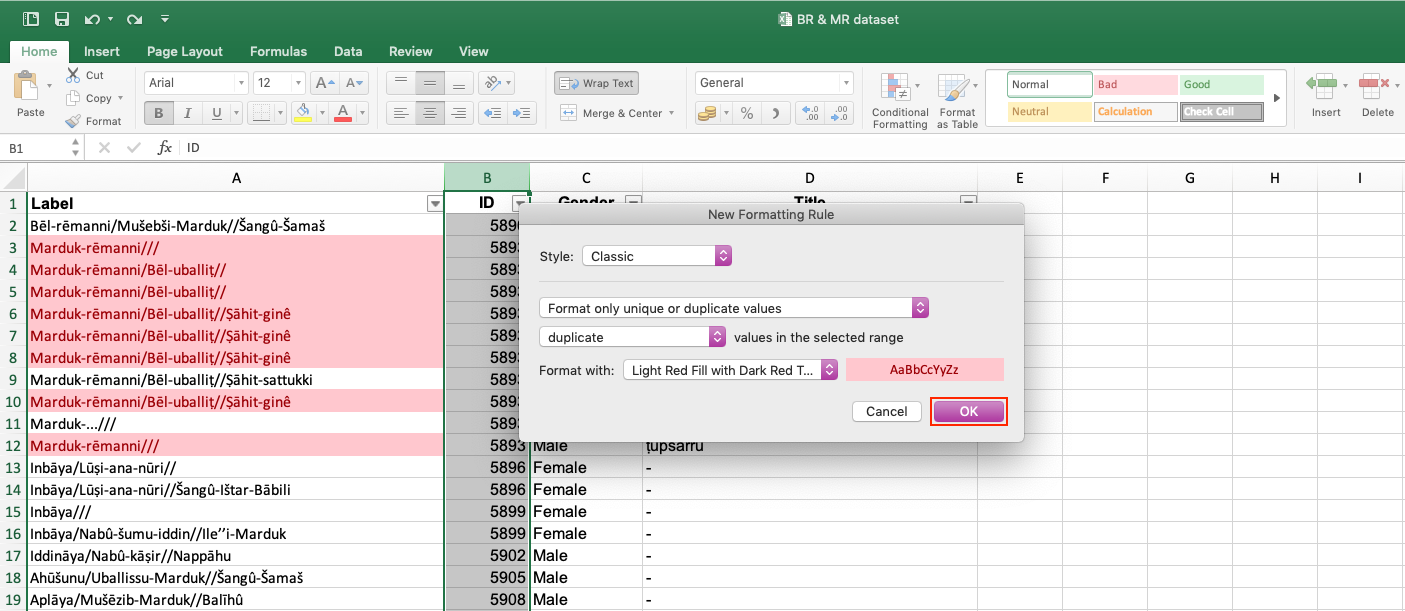
3) Another box opens. Select in which way you want to highlight duplicate values, e.g. Light red fill with dark red text.
|
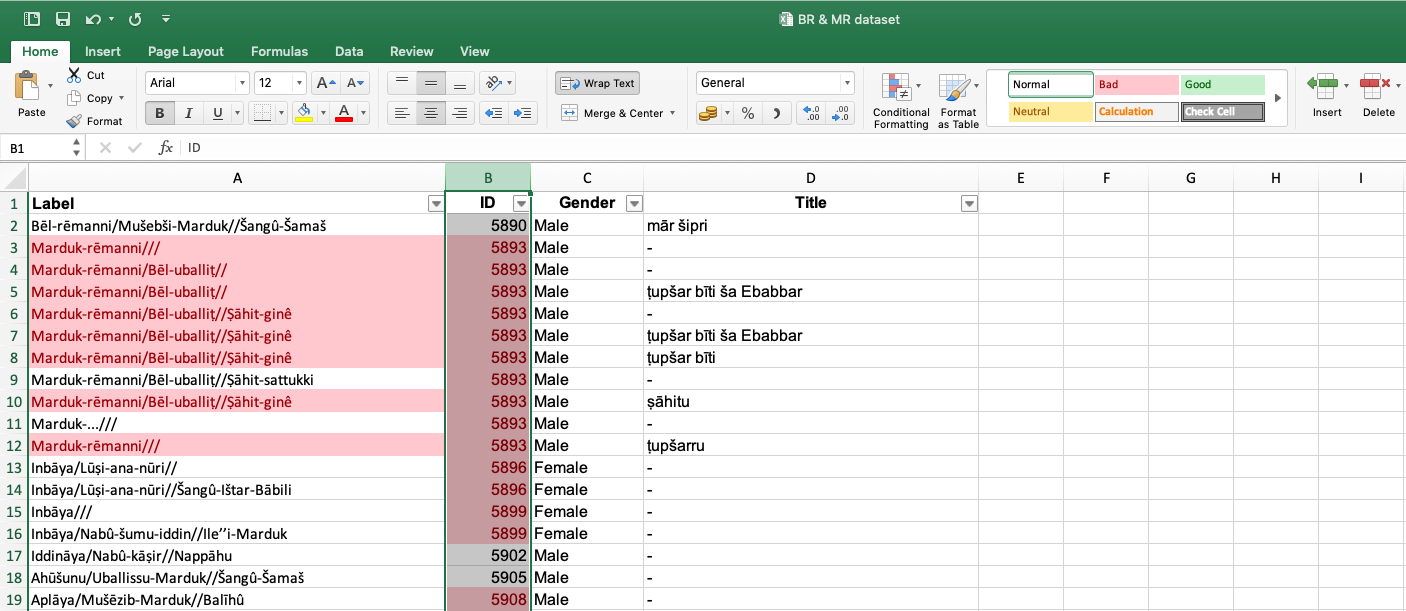
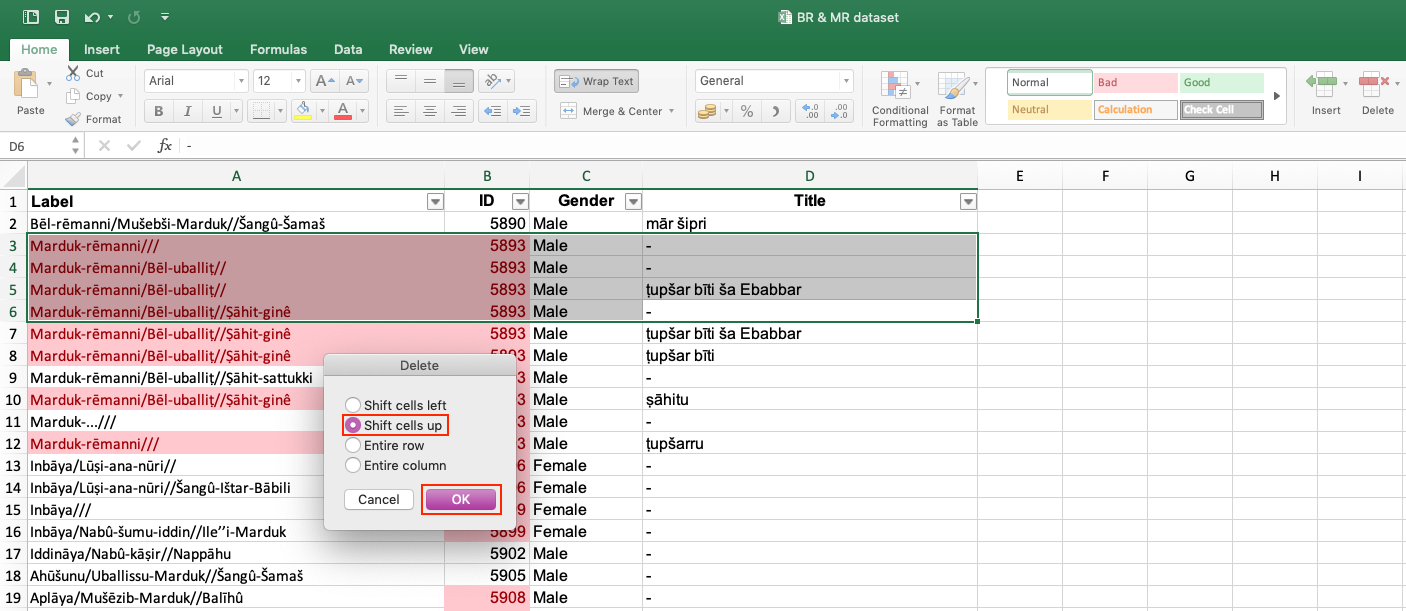
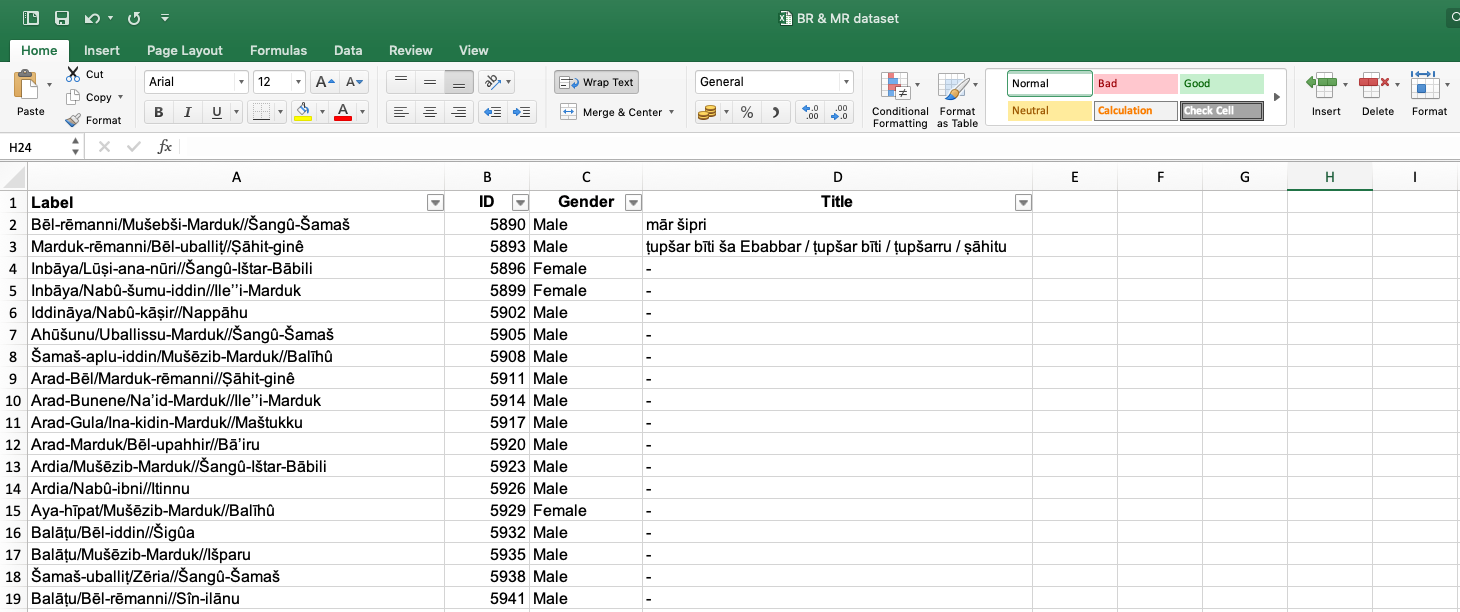
| 4. Highlighting duplicates in the ID column.
Some names are now repeating, but in a different form. E.g. a patronym or family name is sometimes left out. However, they do have the same ID number. To highlight these individuals, repeat step 3 for this column as well.
After highlighting the duplicates, you should remove them manually so you can keep the full/standard name and not a broken/partial one. You can also merge the various titles of one individual by copy-pasting. In that way you will not lose important information.
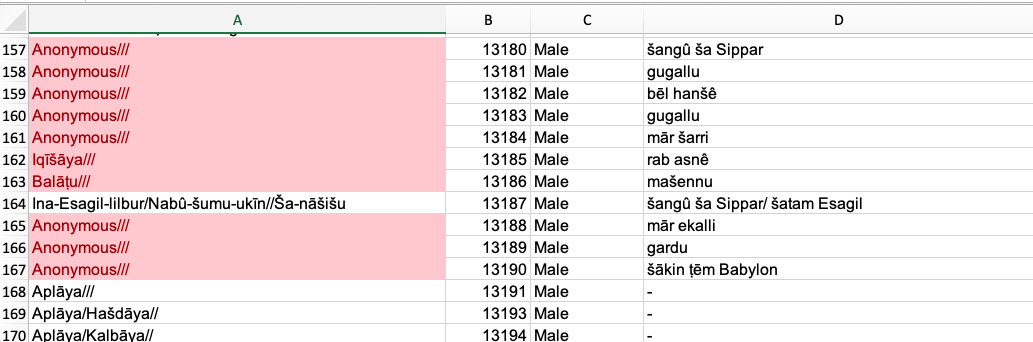
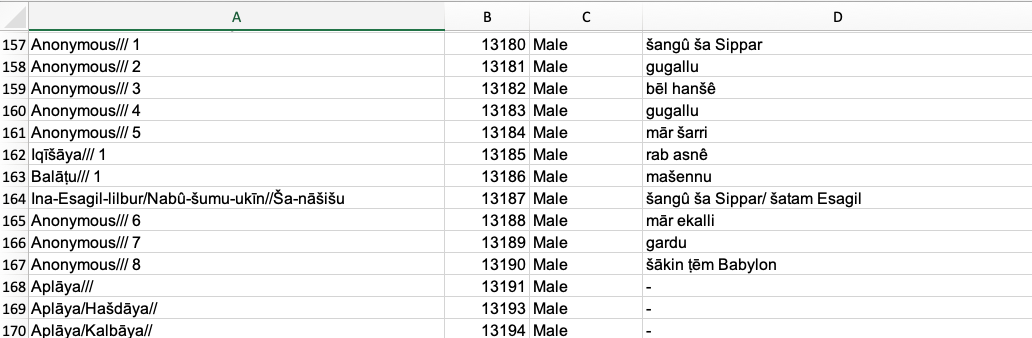
Note that you will have many identical Labels. For example, “Anonymous///”. To change this, add numbers to these Labels. Otherwise Gephi might have problems interpreting your data.
|
- Additional columns: You can include many more columns with various data. These are treated by Gephi as attributes (e.g. “Title” or “Gender”). The attributes are optional and depend on your research question.
- You can delete all other columns, g. Museum number, Archive, etc., as these are not permanent identifiers of the “Nodes”, but apply to the individuals only on specific occasions. In other words, they are tied to a specific text (i.e. a moment in time) rather than being an essential part of the individual’s characteristics (i.e. at all times).
- Include the “text nodes” into your nodes sheet. For this, copy-paste the text column from your Edges sheet right under the last entry in the Label column which contains individuals. Now follow the steps described in the box above to clean duplicates of museum numbers from this column (again)! In addition, give corresponding numbers to your text nodes. You can do this by starting with a group of numbers you have not yet used for your person nodes and then by dragging the column down to make it automatic. You can also choose not to do it — then Gephi will give your text nodes random numbers. The graph will look the same, but you cannot use text labels as effectively on your nodes.
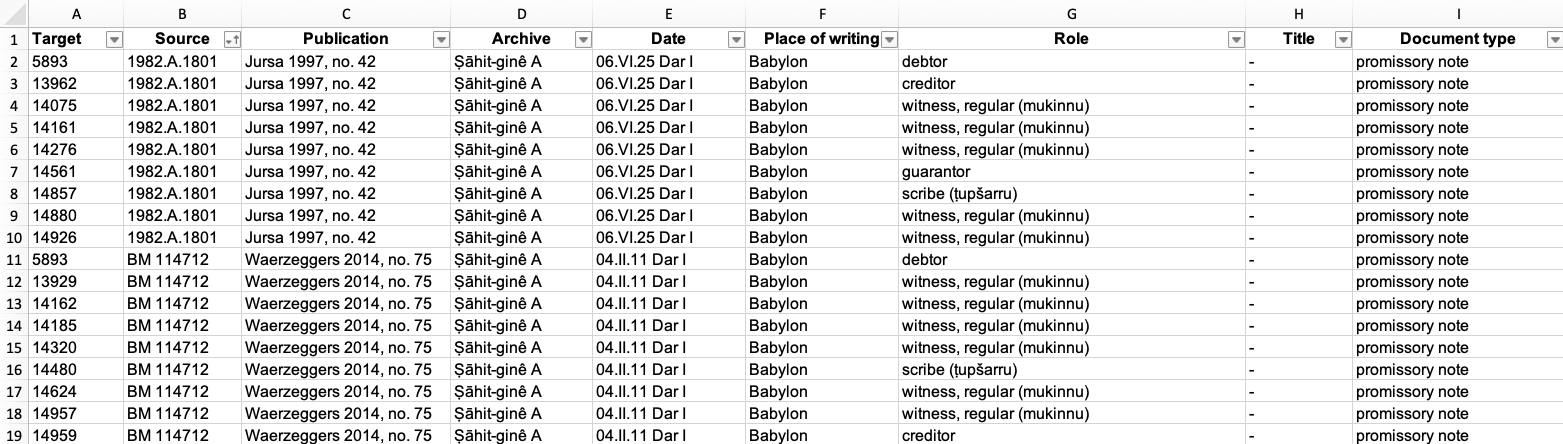
b) Edges sheet
The Excel sheet with edges has to contain the columns “Target” and “Source”.
- Target is an individual (Prosobab: PID = Target).
- Source is a document (Prosobab: Museum number = Source).
In other words, Targets/individuals appear in the Sources/documents. The edges sheet can have repeating values in Target and Source columns. Remember that this is not the case for the nodes sheet columns ID and Label!
- Additional columns. You can use columns containing Role or Subtype (of the document) etc. These allow you to study your network.
The next blog post Part 4 will describe the import of the data for creating a 2-mode network.
If you encounter any problems or find information that needs to be updated, you can let me know via email: m.seire[at]hum.leidenuniv.nl.
Author: Maarja Seire
Published on 28 January 2020
